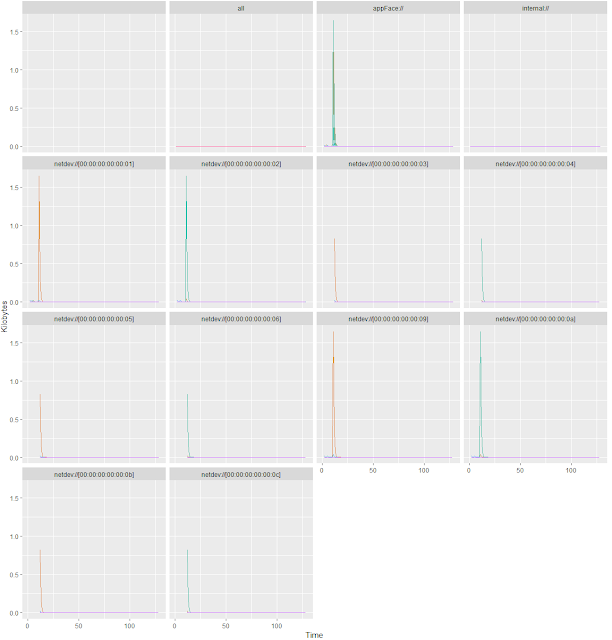
In ndnSIm we can obtain different metrics by default such as rateTracer, appDelayTracer and csTracer. You can even write your own tracer in ndnSIM. Following are some steps which i followed to obtain graphs in R studio using the results generated by ndnSIM.
1. Copy the tracer file (in my case it is rate-trace.txt) from ns-3 folder and paste it into the working directory of R Studio (recommended).
Note: type getwd() in R studio console and it will show you the path to the working directory. In my case the path is ("C:/Users/Atif/Documents").
2. Install ggplot2 package in R studio if you don't have it already.
3. Run following code for and get all graphs
Conclusion
Above mentioned steps are very basic and easy to use. if you have any question you can comment on this post.
1. Copy the tracer file (in my case it is rate-trace.txt) from ns-3 folder and paste it into the working directory of R Studio (recommended).
Note: type getwd() in R studio console and it will show you the path to the working directory. In my case the path is ("C:/Users/Atif/Documents").
2. Install ggplot2 package in R studio if you don't have it already.
3. Run following code for and get all graphs
library (ggplot2)
data = read.table("C:/Users/Atif/Documents/rate-trace.txt", header=TRUE)
ggplot(data, aes(x=Time, y=Kilobytes, color=Type)) + geom_line () + facet_wrap(~ FaceDescr)
Conclusion
Above mentioned steps are very basic and easy to use. if you have any question you can comment on this post.


Comments
Post a Comment